
.png?fit=max&auto=format&n=hWBn50UiAZnOwoHI&q=85&s=6b3d6f29082e9ecfe13a87ffa36688d4)
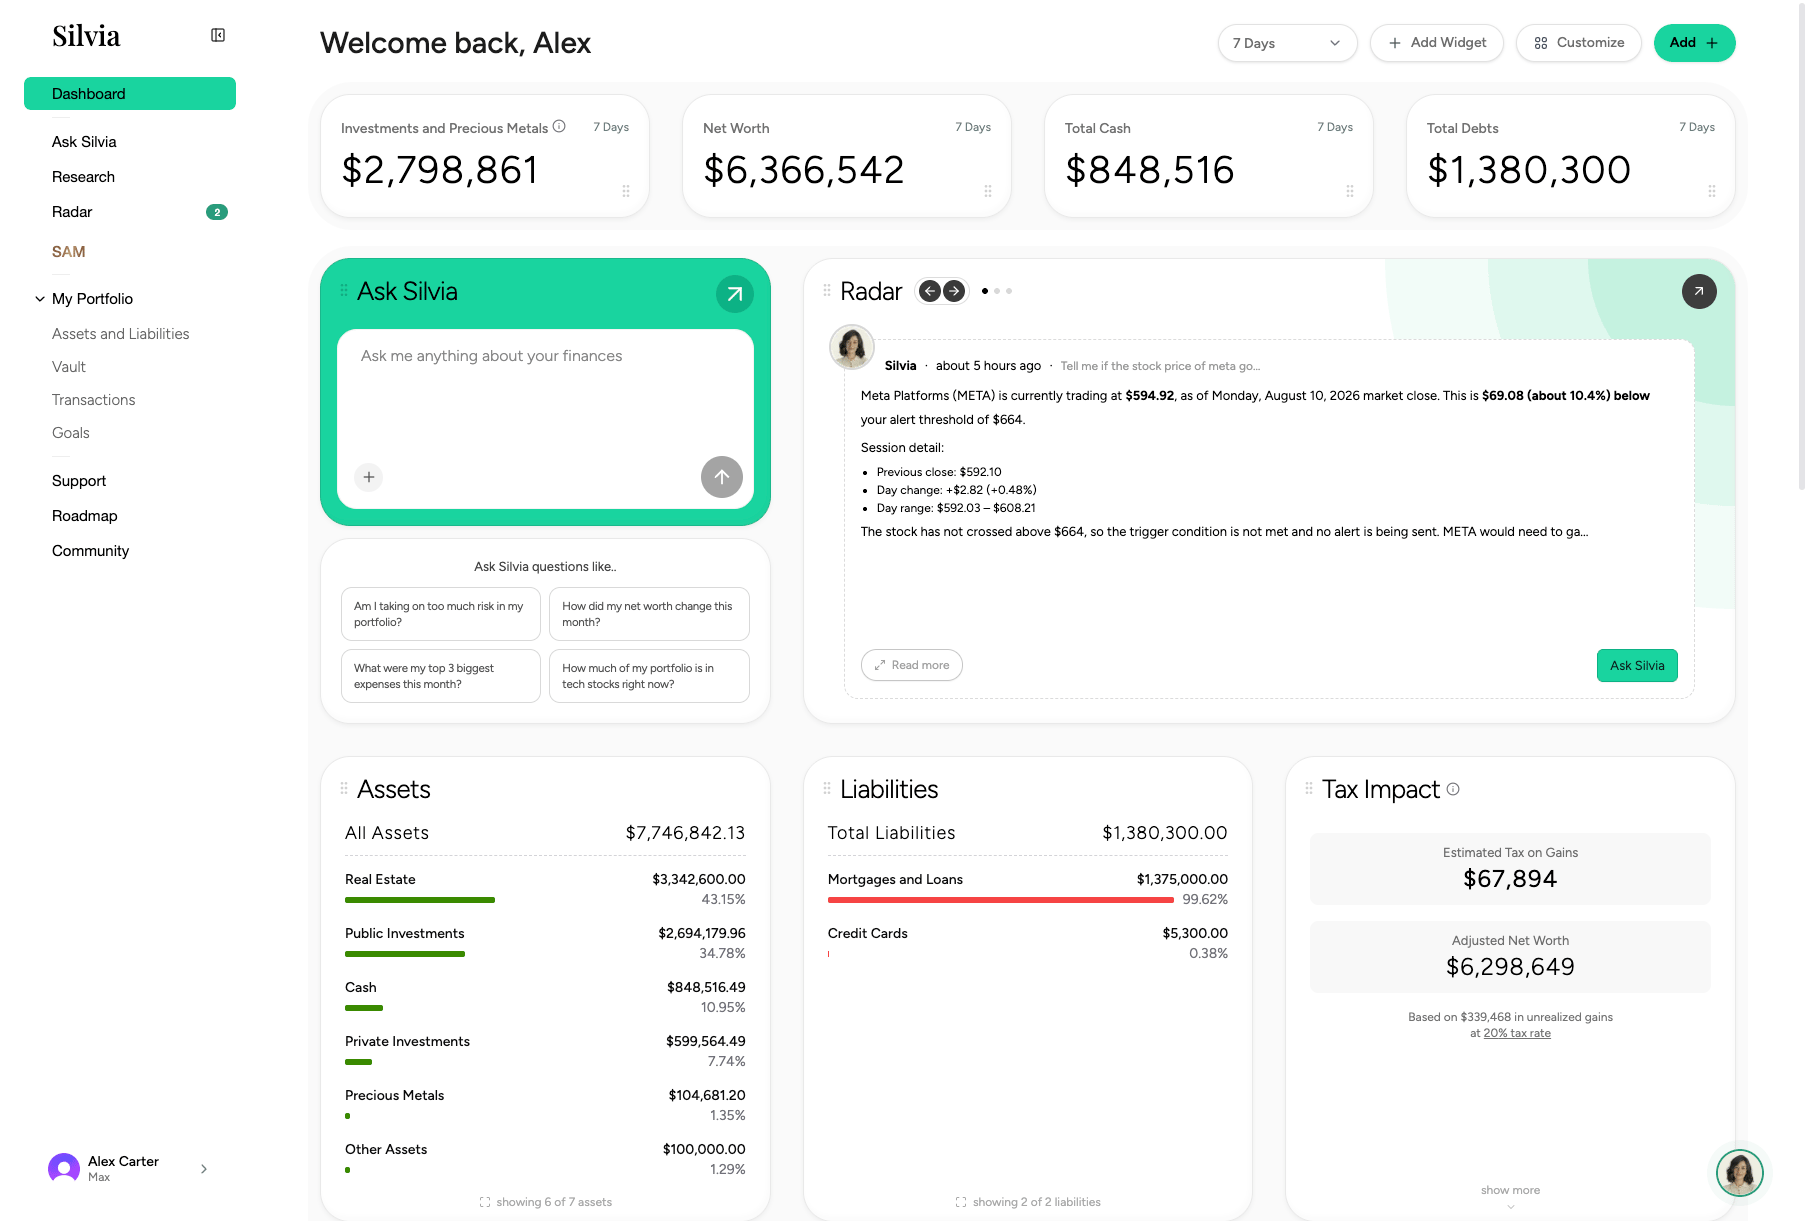
Silvia Dashboard
What you’ll see
Net worth
Assets minus liabilities, with historical trend.
Cash flow
Income minus spending over the current period.
Portfolio breakdown
Allocation across cash, investments, real estate, and more.
Top movers
The holdings that moved most today.
Time ranges
Use the range selector at the top of each chart to view 1D, 1W, 1M, 3M, YTD, 1Y, or All.Actions from the Dashboard
- Add account: Opens Connect Account.
- Ask Silvia: Jump into a chat with context from your dashboard.
- Reconnect: If a linked account needs re-authentication, a banner will appear.